
2.671 Measurement and Instrumentation Project | Experimental Analysis of Pop Noise Filters

In this course on measurement methods and experimental techniques offered by the MIT Mechanical Engineering department, I engaged in a self-directed project on the effects of mesh material and hole density on the performance of microphone pop filters. I performed a series of audio experiments using avariety of pop filter meshes. Analysing the audio collected through audio processing software as well as MATLAB, to collect quantitative as well as quantitative data. The project culminated in a research paper as well as a poster session where I delineated and presented on my findings, and received feedback on my process and data analysis methods from lab instructors, MIT Professors, and fellow students alike.
Key Skills : literature review, writing research papers, designing and performing experiments, interpreting and presenting data, data analysis using MATLAB, audio processing
Project Abstract and Background
 Pop filters refer to a mesh that is placed in front of microphones to dampen vibrations from the sudden burst of air released while articulating plosive consonants ('p’,‘b‘‚‘t’,’d‘,’k’ and ‘g‘). These air bursts are a common source of audio distortion, causing harsh or unpleasant noise and clipped audio resulting in misinterpreted or unintelligible audio. In order to characterize key parameters affecting the effectiveness of pop filters, plosive-heavy audio samples were recorded simultaneously, filtered and unfiltered. The material and mesh density of the filters were varied, comparing stainless steel, polyester plastic and nylon plastic meshes and varying the open area percentage from 24% to 46%. 30 audio samples were recorded using each filter, with each audio sample containing plosive phrases and isolated consonants articulated at different volumes. Fourier analysis was performed on the recorded waveforms to provide quantitative comparisons alongside the qualitative analysis of the output. Results showed that the finer, 24% plastic mesh disk was the most effective at filtering the plosives without muffling or damping other tonal qualities in the process.
To begin the analysis of plosive filtering, a comprehensive background on the definition of plosive consonants, the mechanism of their articulation, and how the resultant distortion phenomena manifest is provided.This followed by a brief history of plosive filter analysis before transitioning to the experimental characterization of sample pop filters.
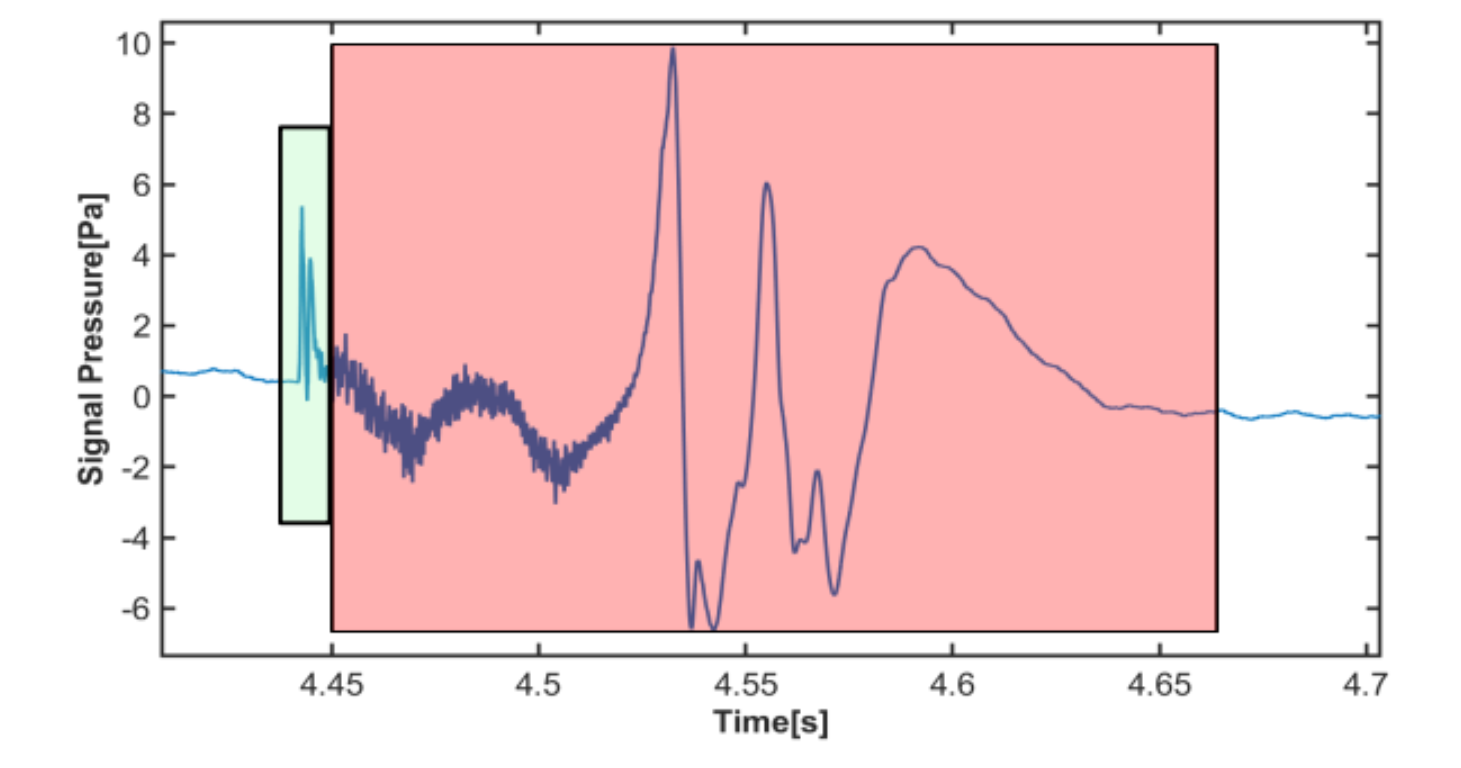 Fig. 1: Waveform observed after the articulation of a singular plosive, ‘p’ into an unfiltered USB microphone The green box indicates the articulated plosive itself, while the red box indicates the associated “Noise train” associated with the distortion.
Pop filters function by deflecting or diffusing much of this air blast when placed in between the sound source and the microphone. They should, however, still allow the sound input to reach the recording device without absorbing desired sound frequencies, that is, they should maintain acoustic transparency.
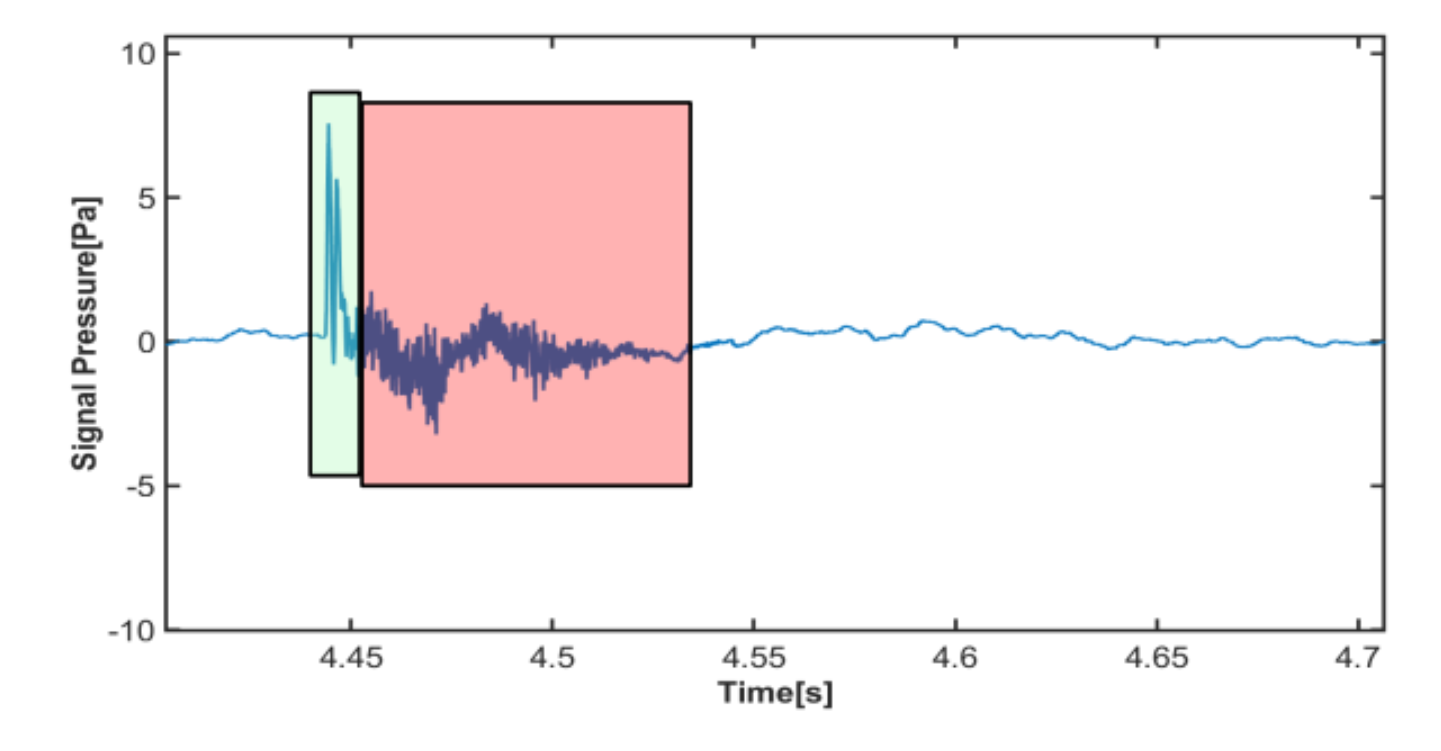 Fig. 2: Waveform observed after the articulation of a singular plosive, ‘p’ into filtered USB microphone The green box indicates the articulated plosive itself, while the red box indicates the associated “Noise train” associated with the distortion. Note the significant reduction in noise train length and intensity for the same plosive input.
Experimental Setup and Design
The recording of filtered and unfiltered data was performed simultaneously in a recording studio to minimize influence of external phenomena. Two identical and calibrated microphones, filtered and unfiltered, were placed equidistant from the speaker. A third microphone present in the studio was used as a second control, providing industry standard microphone and pop filter performance for overall comparison. The filters used were of two materials each with two mesh disks of varied transparency, having open area percentages of 24% and 46%. Individual plosives such as the single letter ‘p’ as well as alliterative phrases like the famous “Peter Piper picked a pack of pickled peppers” were repeated severally with each filter type.
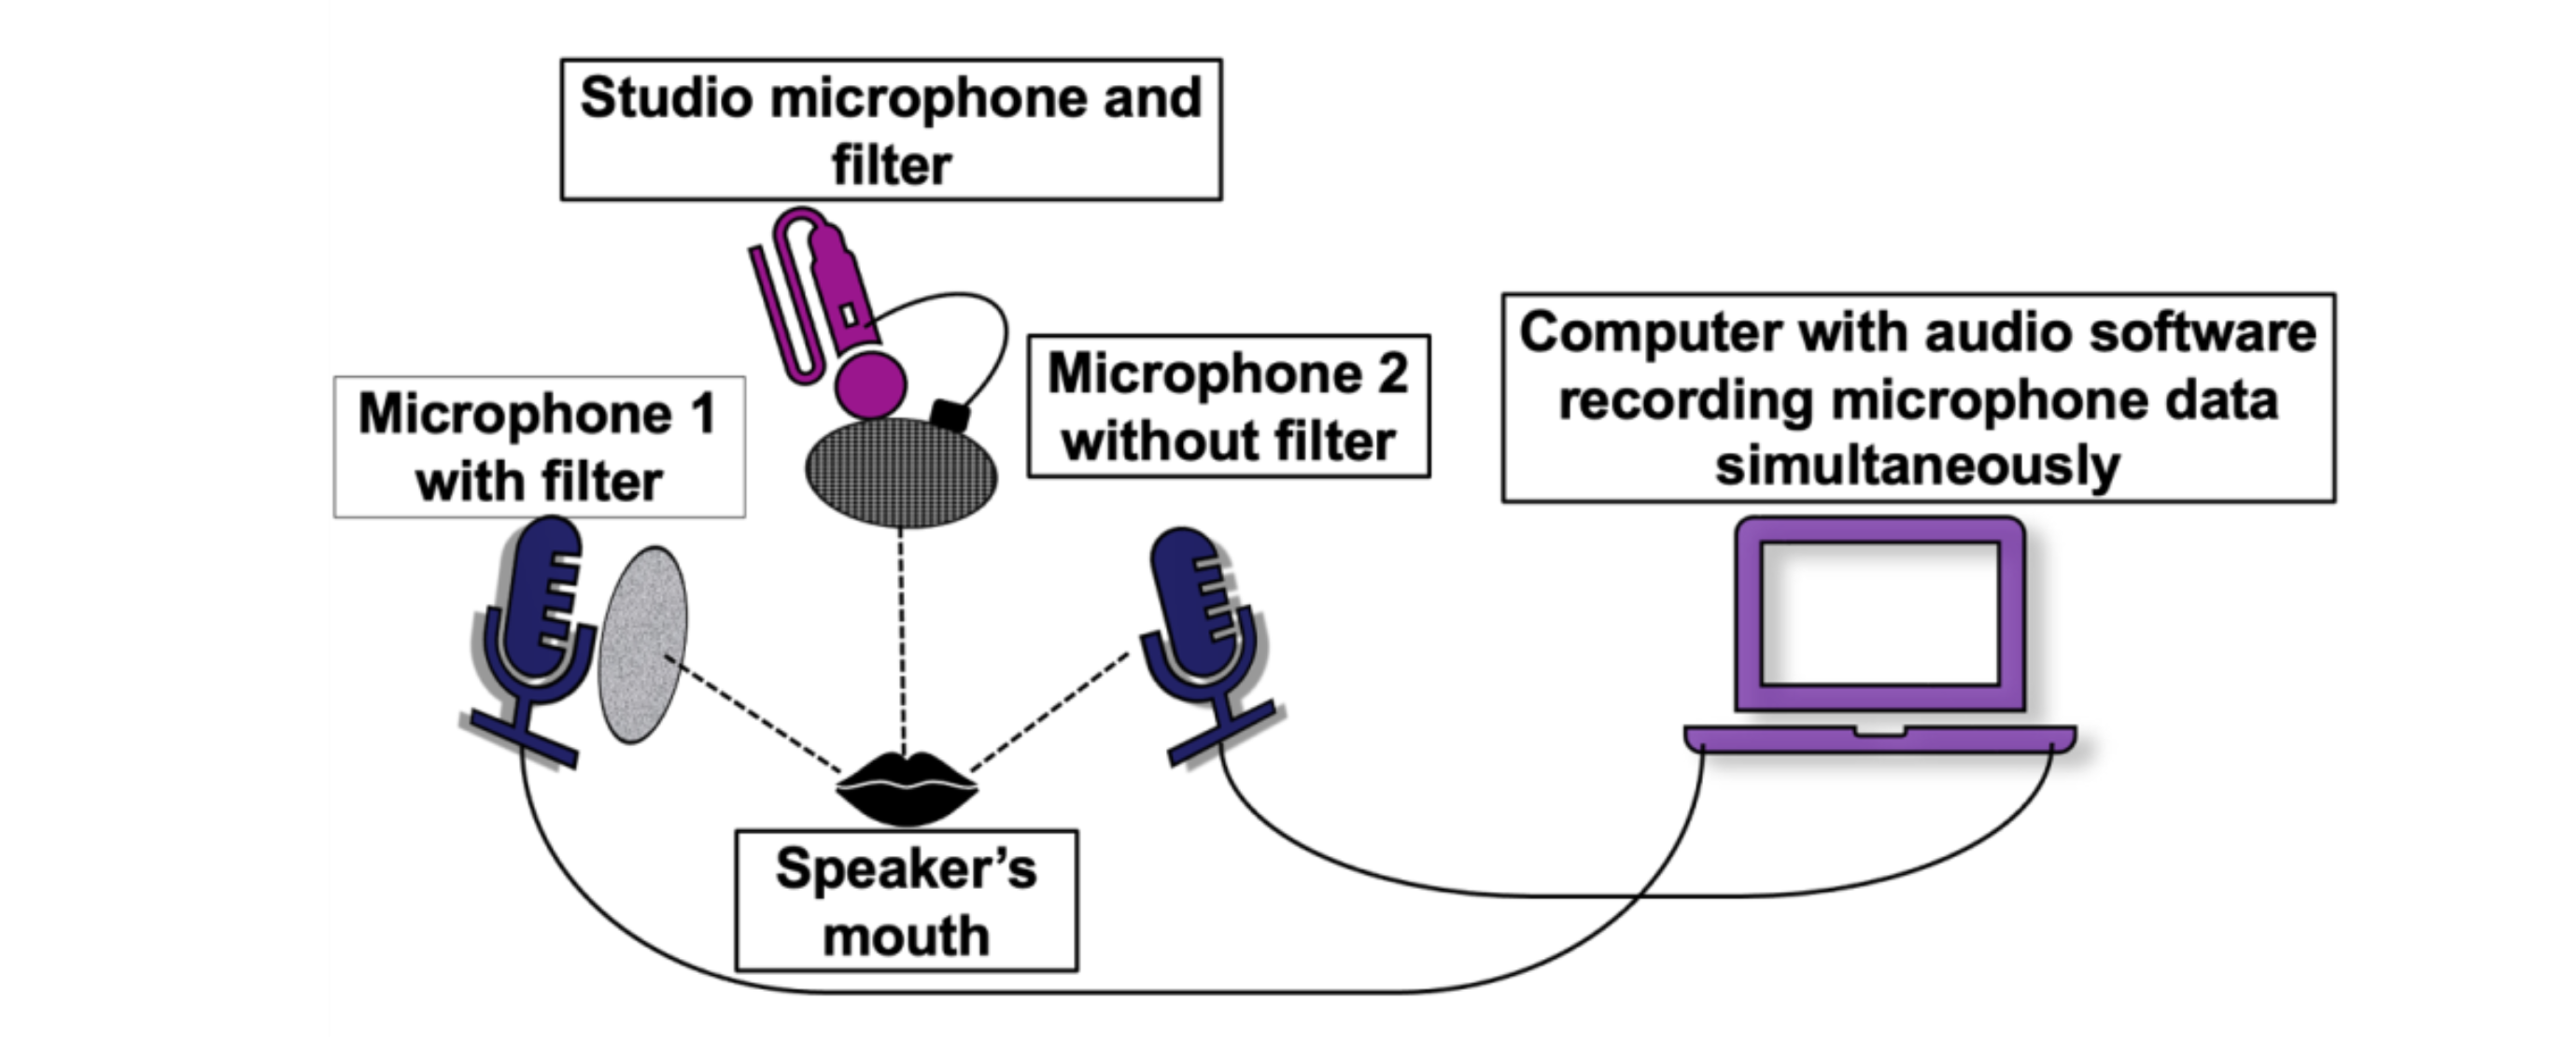
Fig. 3: Schematic of Experimental Setup
Audio Processing
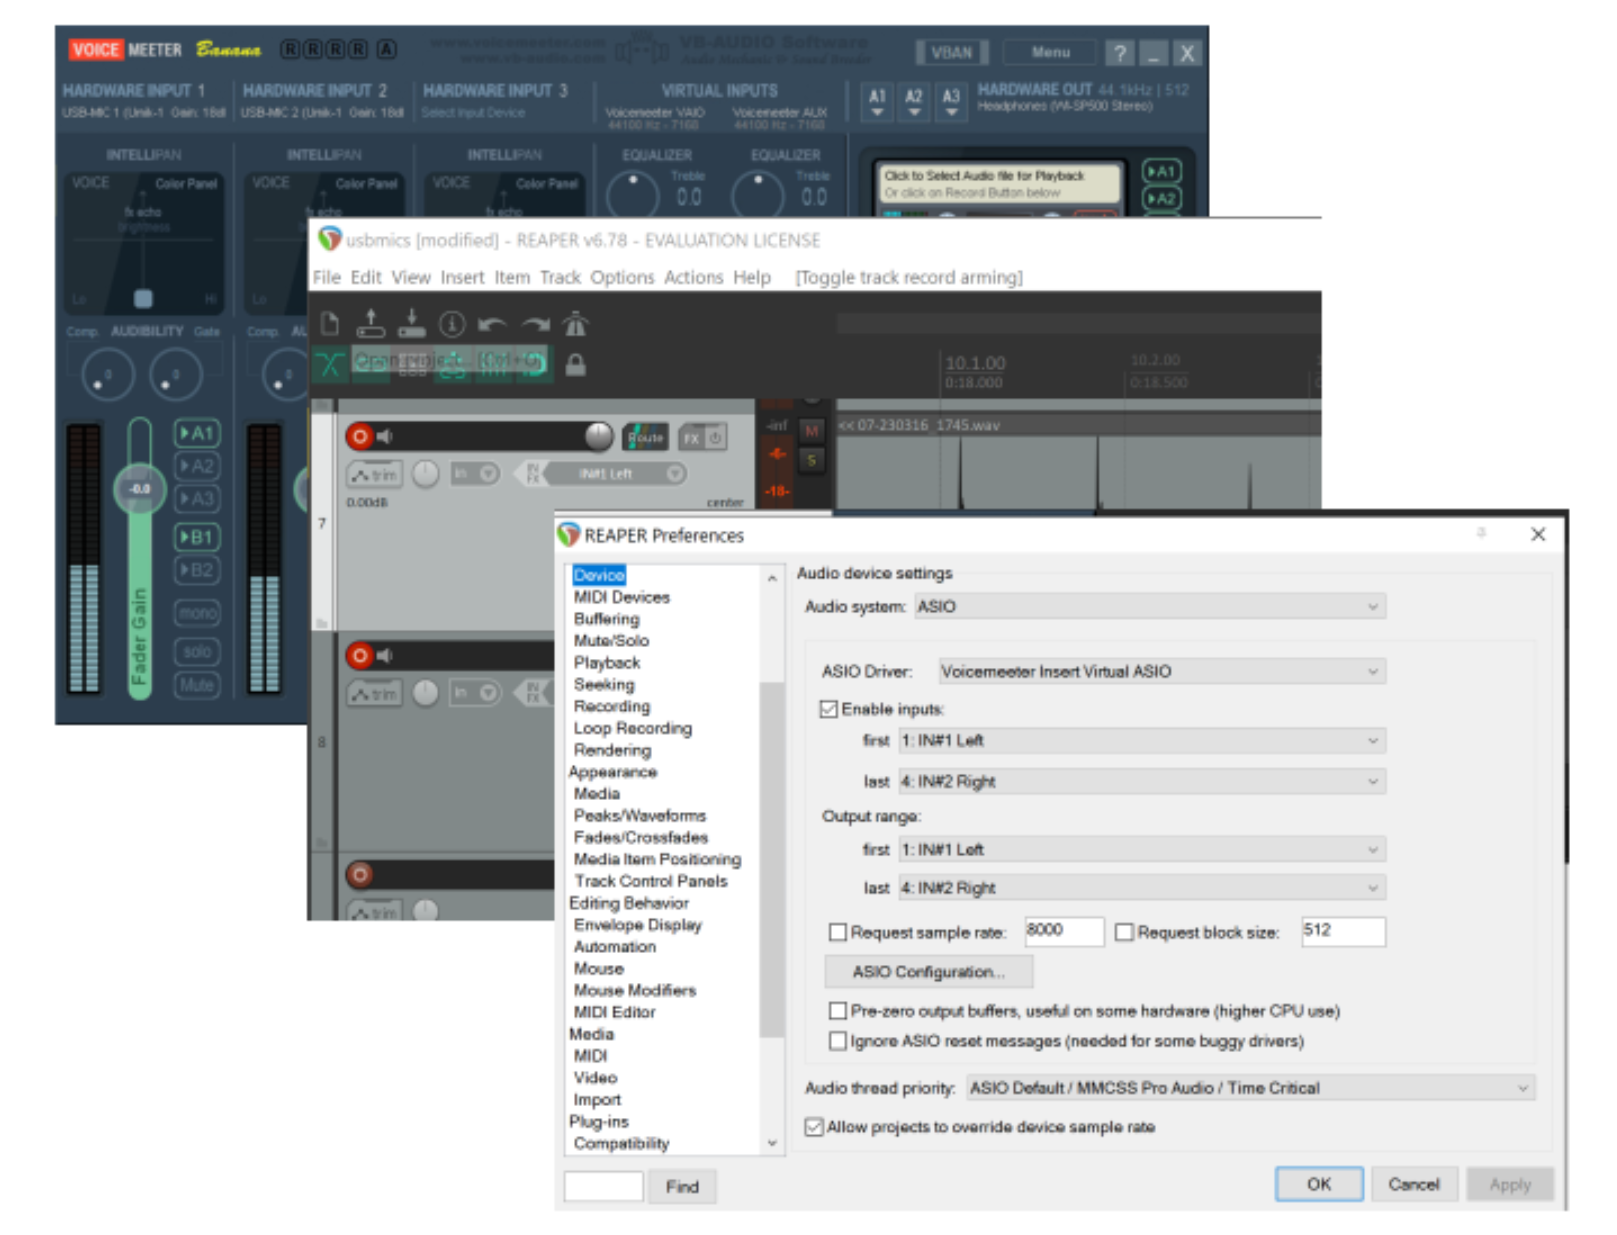 Voicemeeter Banana was used to route two separate soundtracks for the identical control and test sound microphones. Reaper Audio software with ASIO add-on was used to record .wav data, as it pairs well with Voicemeeter for simultaneous but separate track recording. Microphones were synchronized with studio mic (separate computer) by clapping/tapping thrice. Each microphone input was labelled according ASIO driver settings. Audio data for every filter type is then imported into MATLAB and plotted as signal pressure graphs against time. From the audio processing software, we can obtain a time window of a single plosive articulation, to inspect the difference in noise trains of the filtered and unfiltered samples.
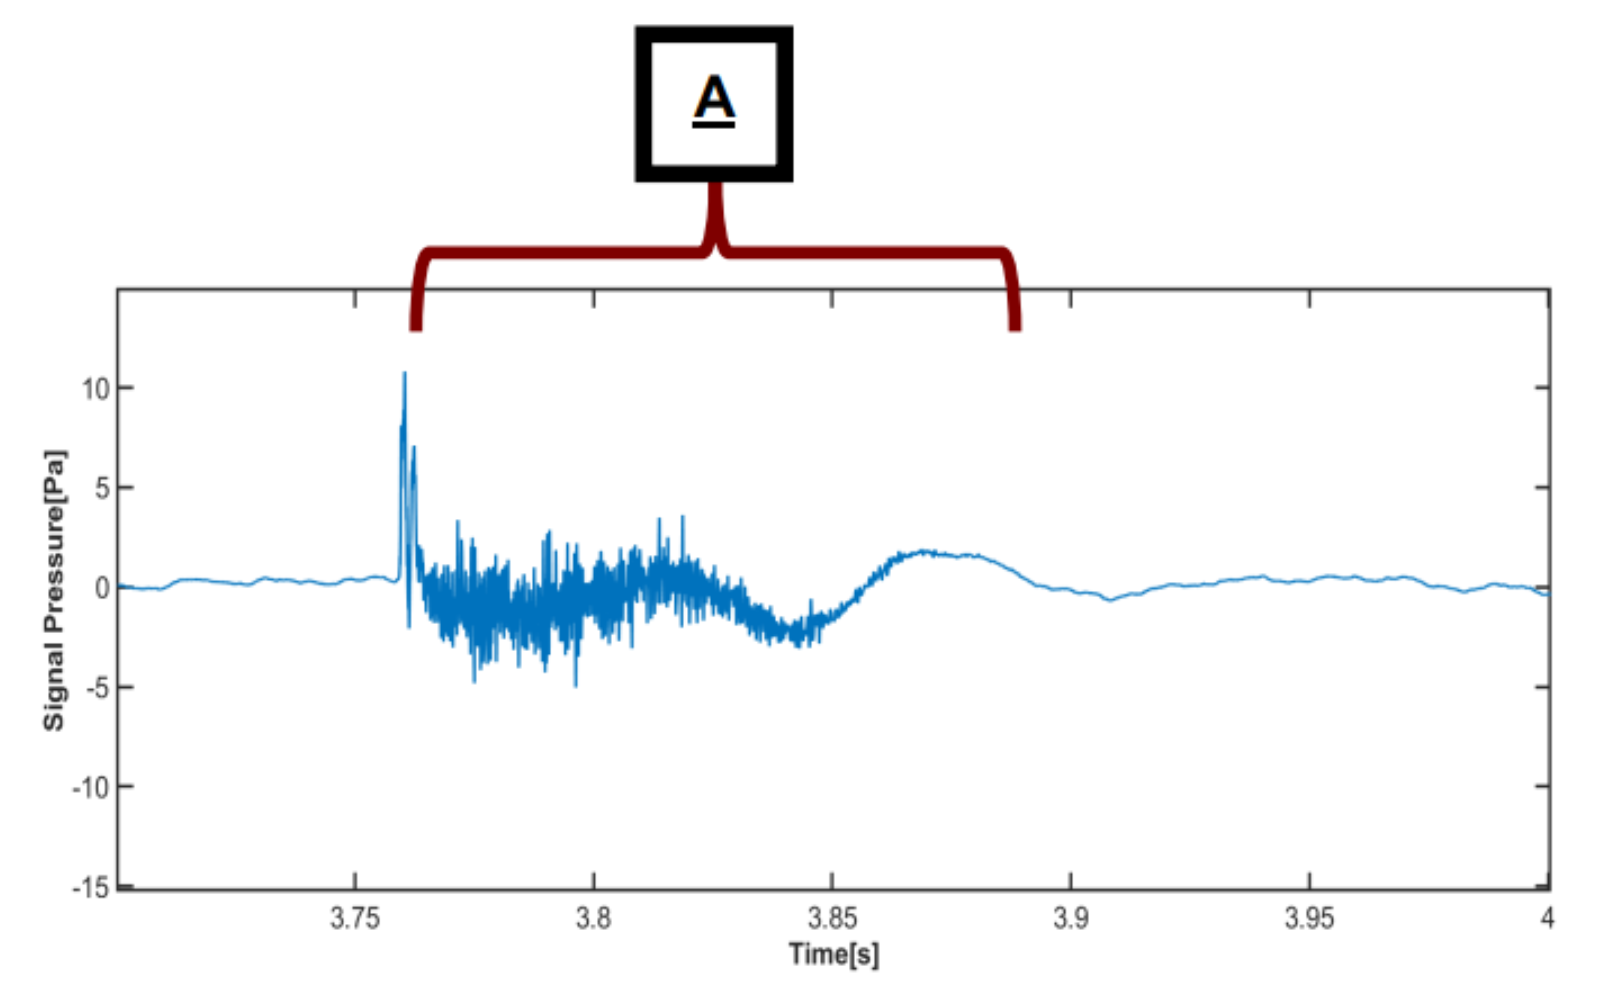
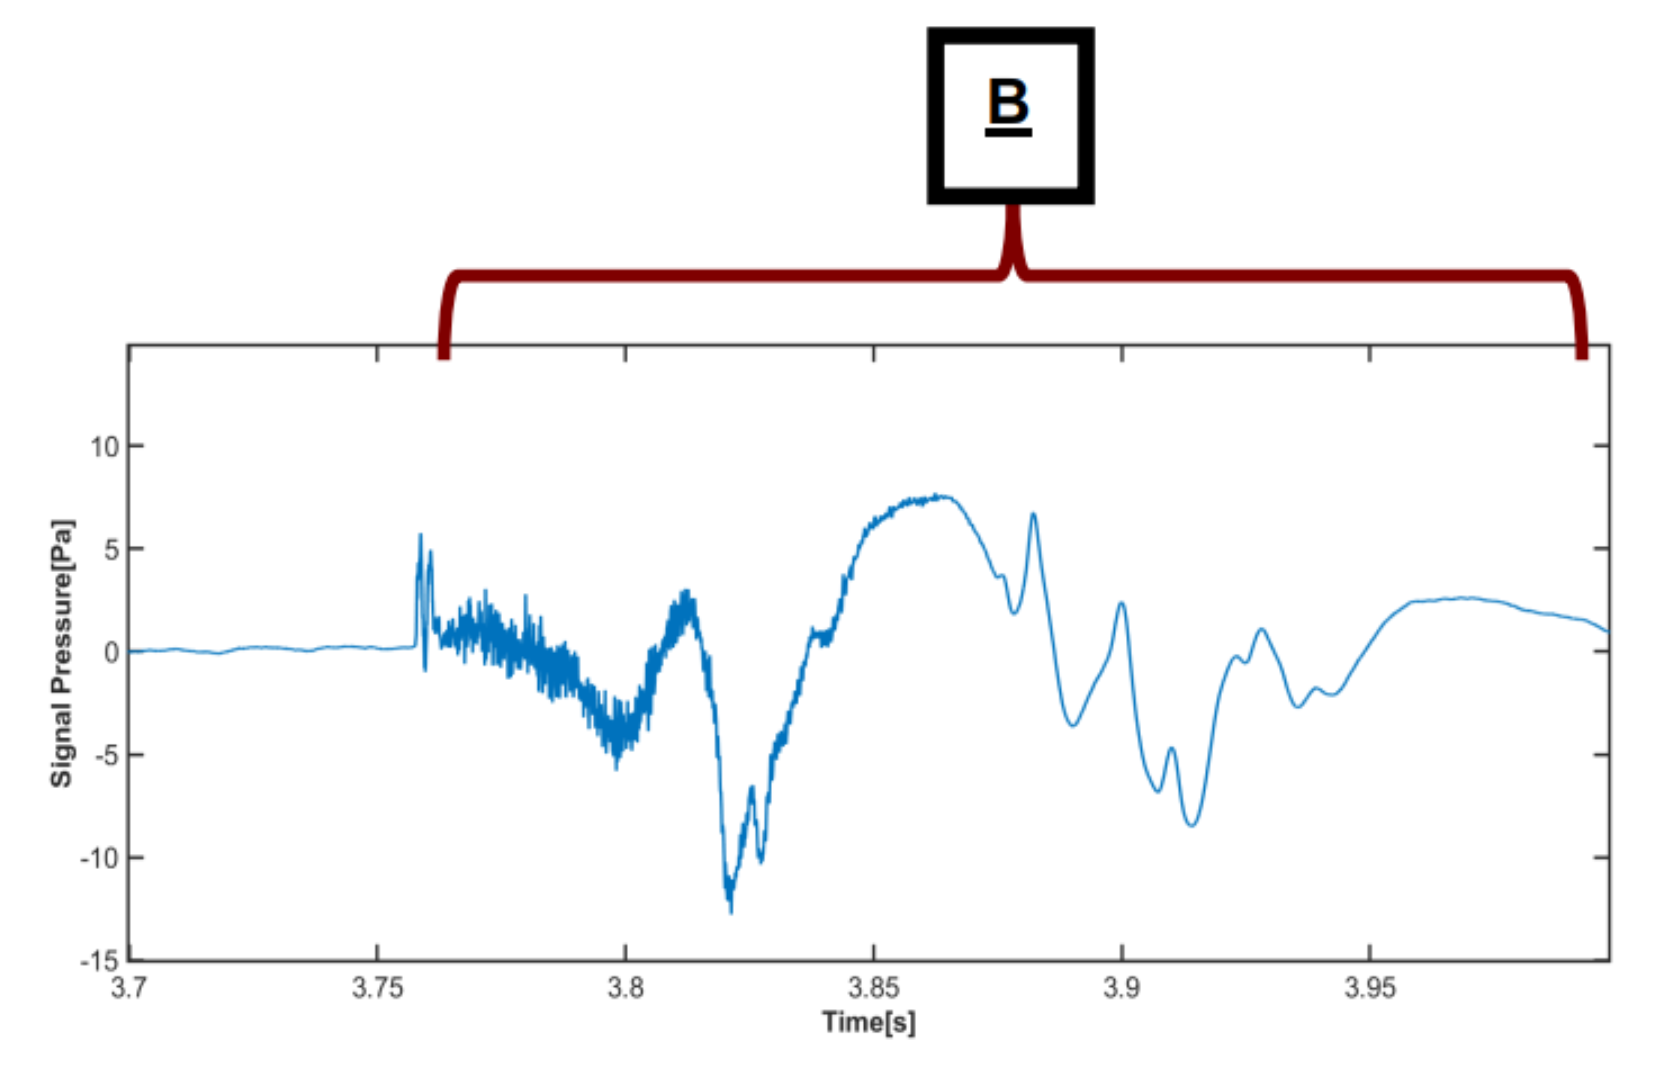
An example is illustrated in the figures below:
Articulated plosive 'p' under:
-filtered conditions demonstrating minimal/quieter noise train, A
-unfiltered conditions demonstrating a louder, longer noise train,B
Data Analysis
FOURIER ANALYSIS FOR CHARACTERIZATION OF PLOSIVE ARTEFACTS
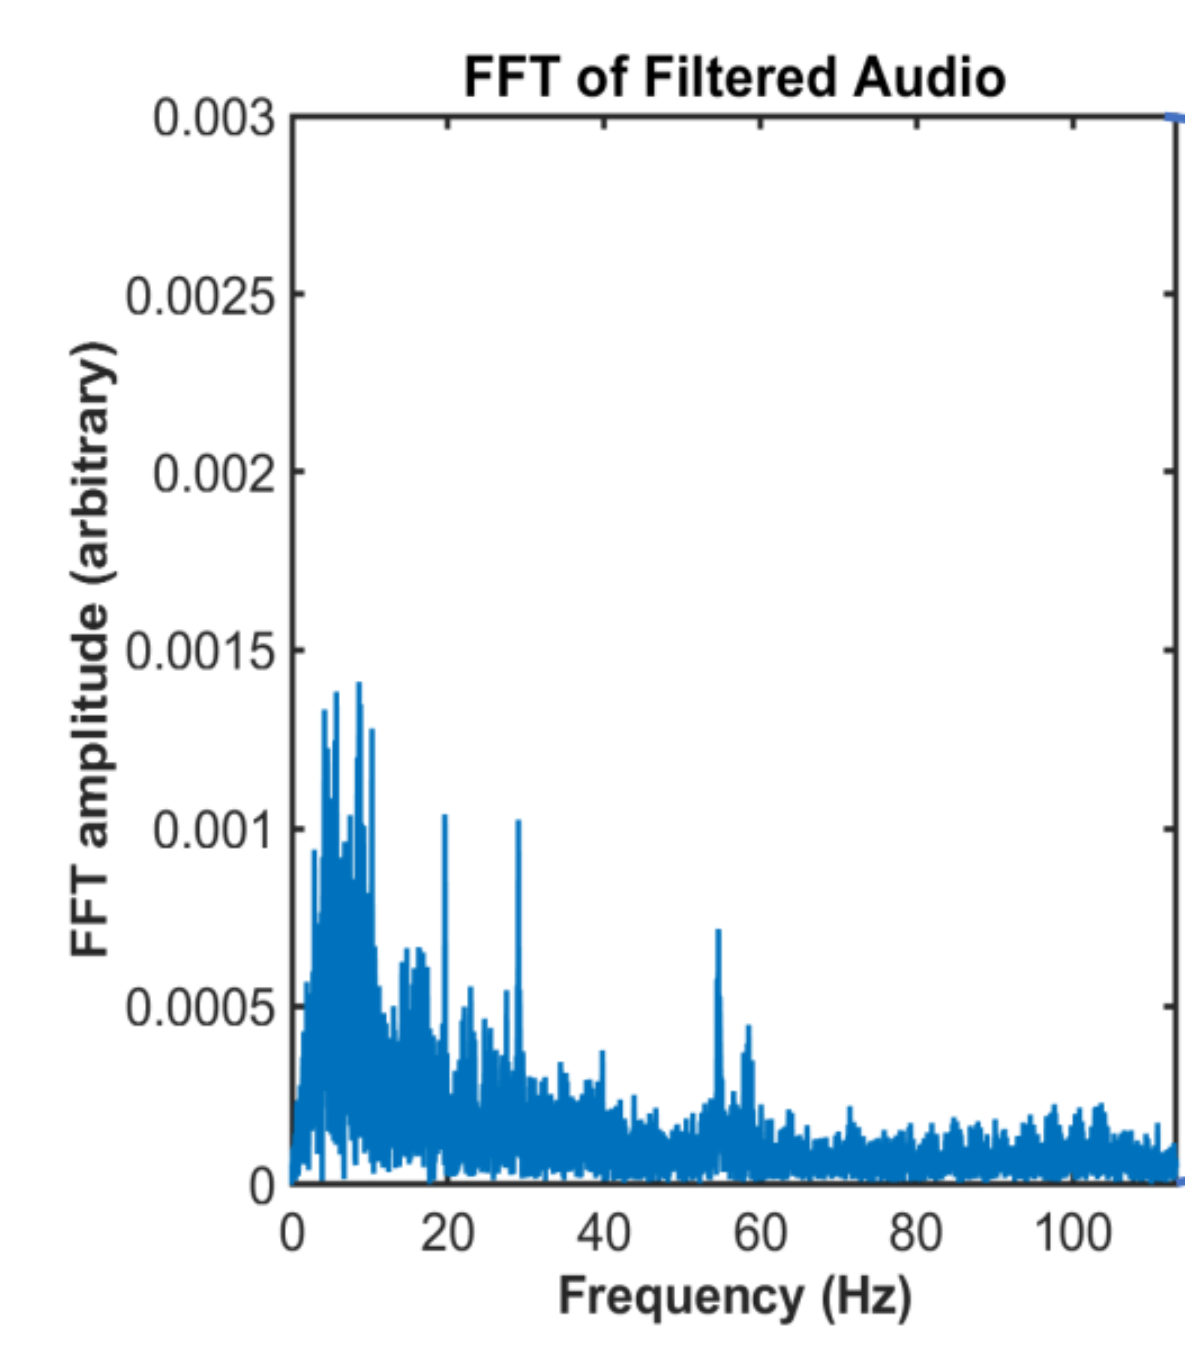
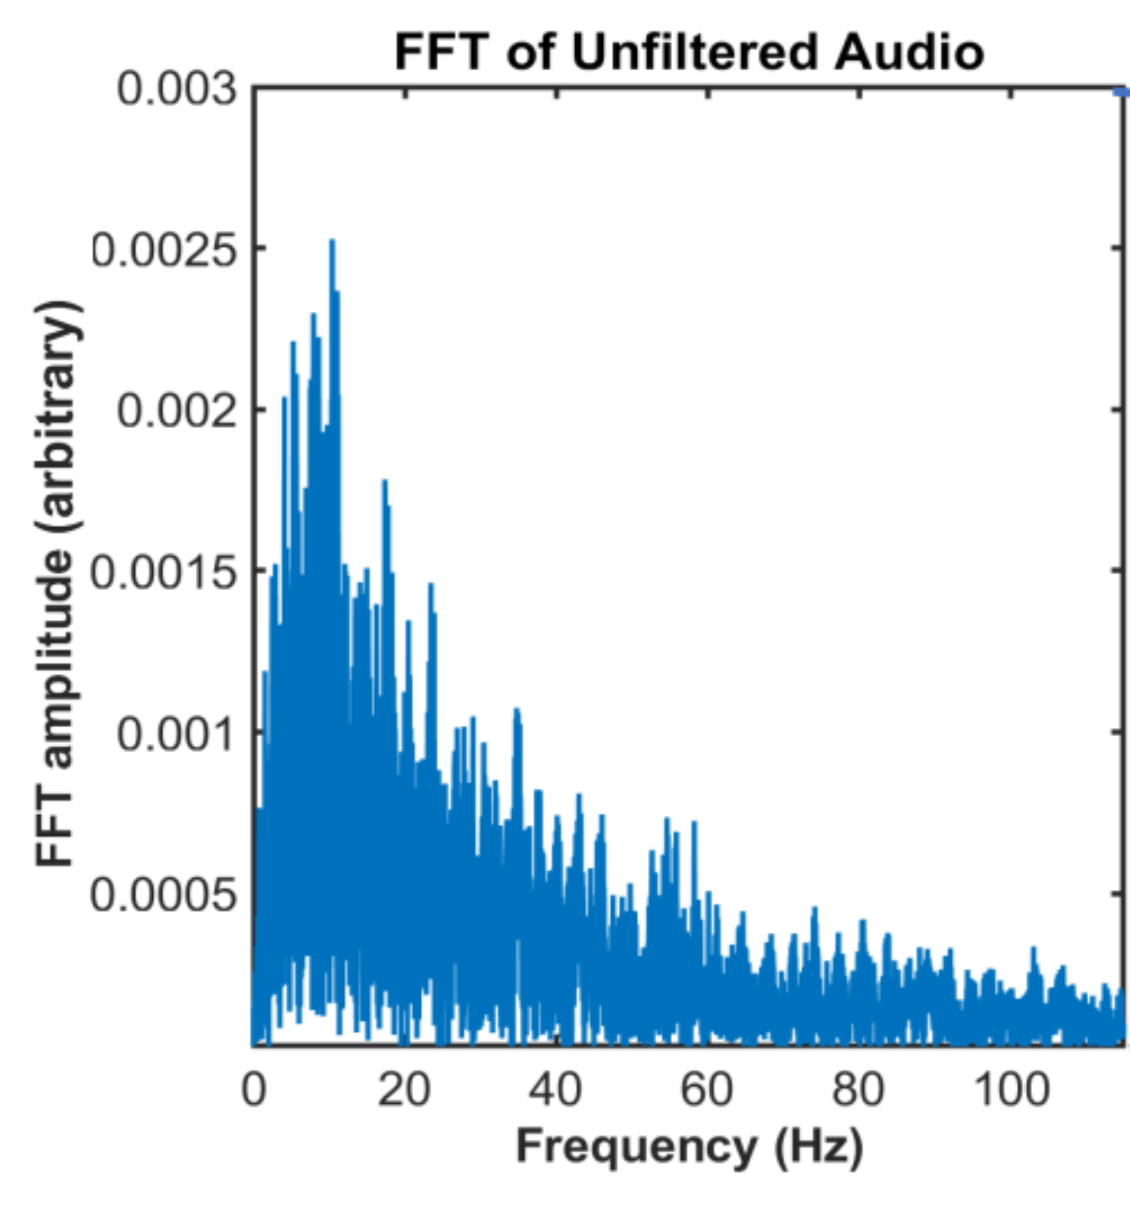
Literature review shows that the distortions associated with plosives are characterized as low frequency phenomena. This was confirmed quantitatively in the Fast Fourier Transform (FFT) graphs of the recorded plosives that I generated and verified qualitatively by listening to the audio clips. The figures below represent FFT graphs of audio data of several plosive letters and sentences recorded simultaneously on a filtered and unfiltered microphone. The higher frequency data to the right of the graph is similar for both samples, but on closer inspection of the lower frequency data there is a significantly larger spike seen with the unfiltered sample as seen in figures below
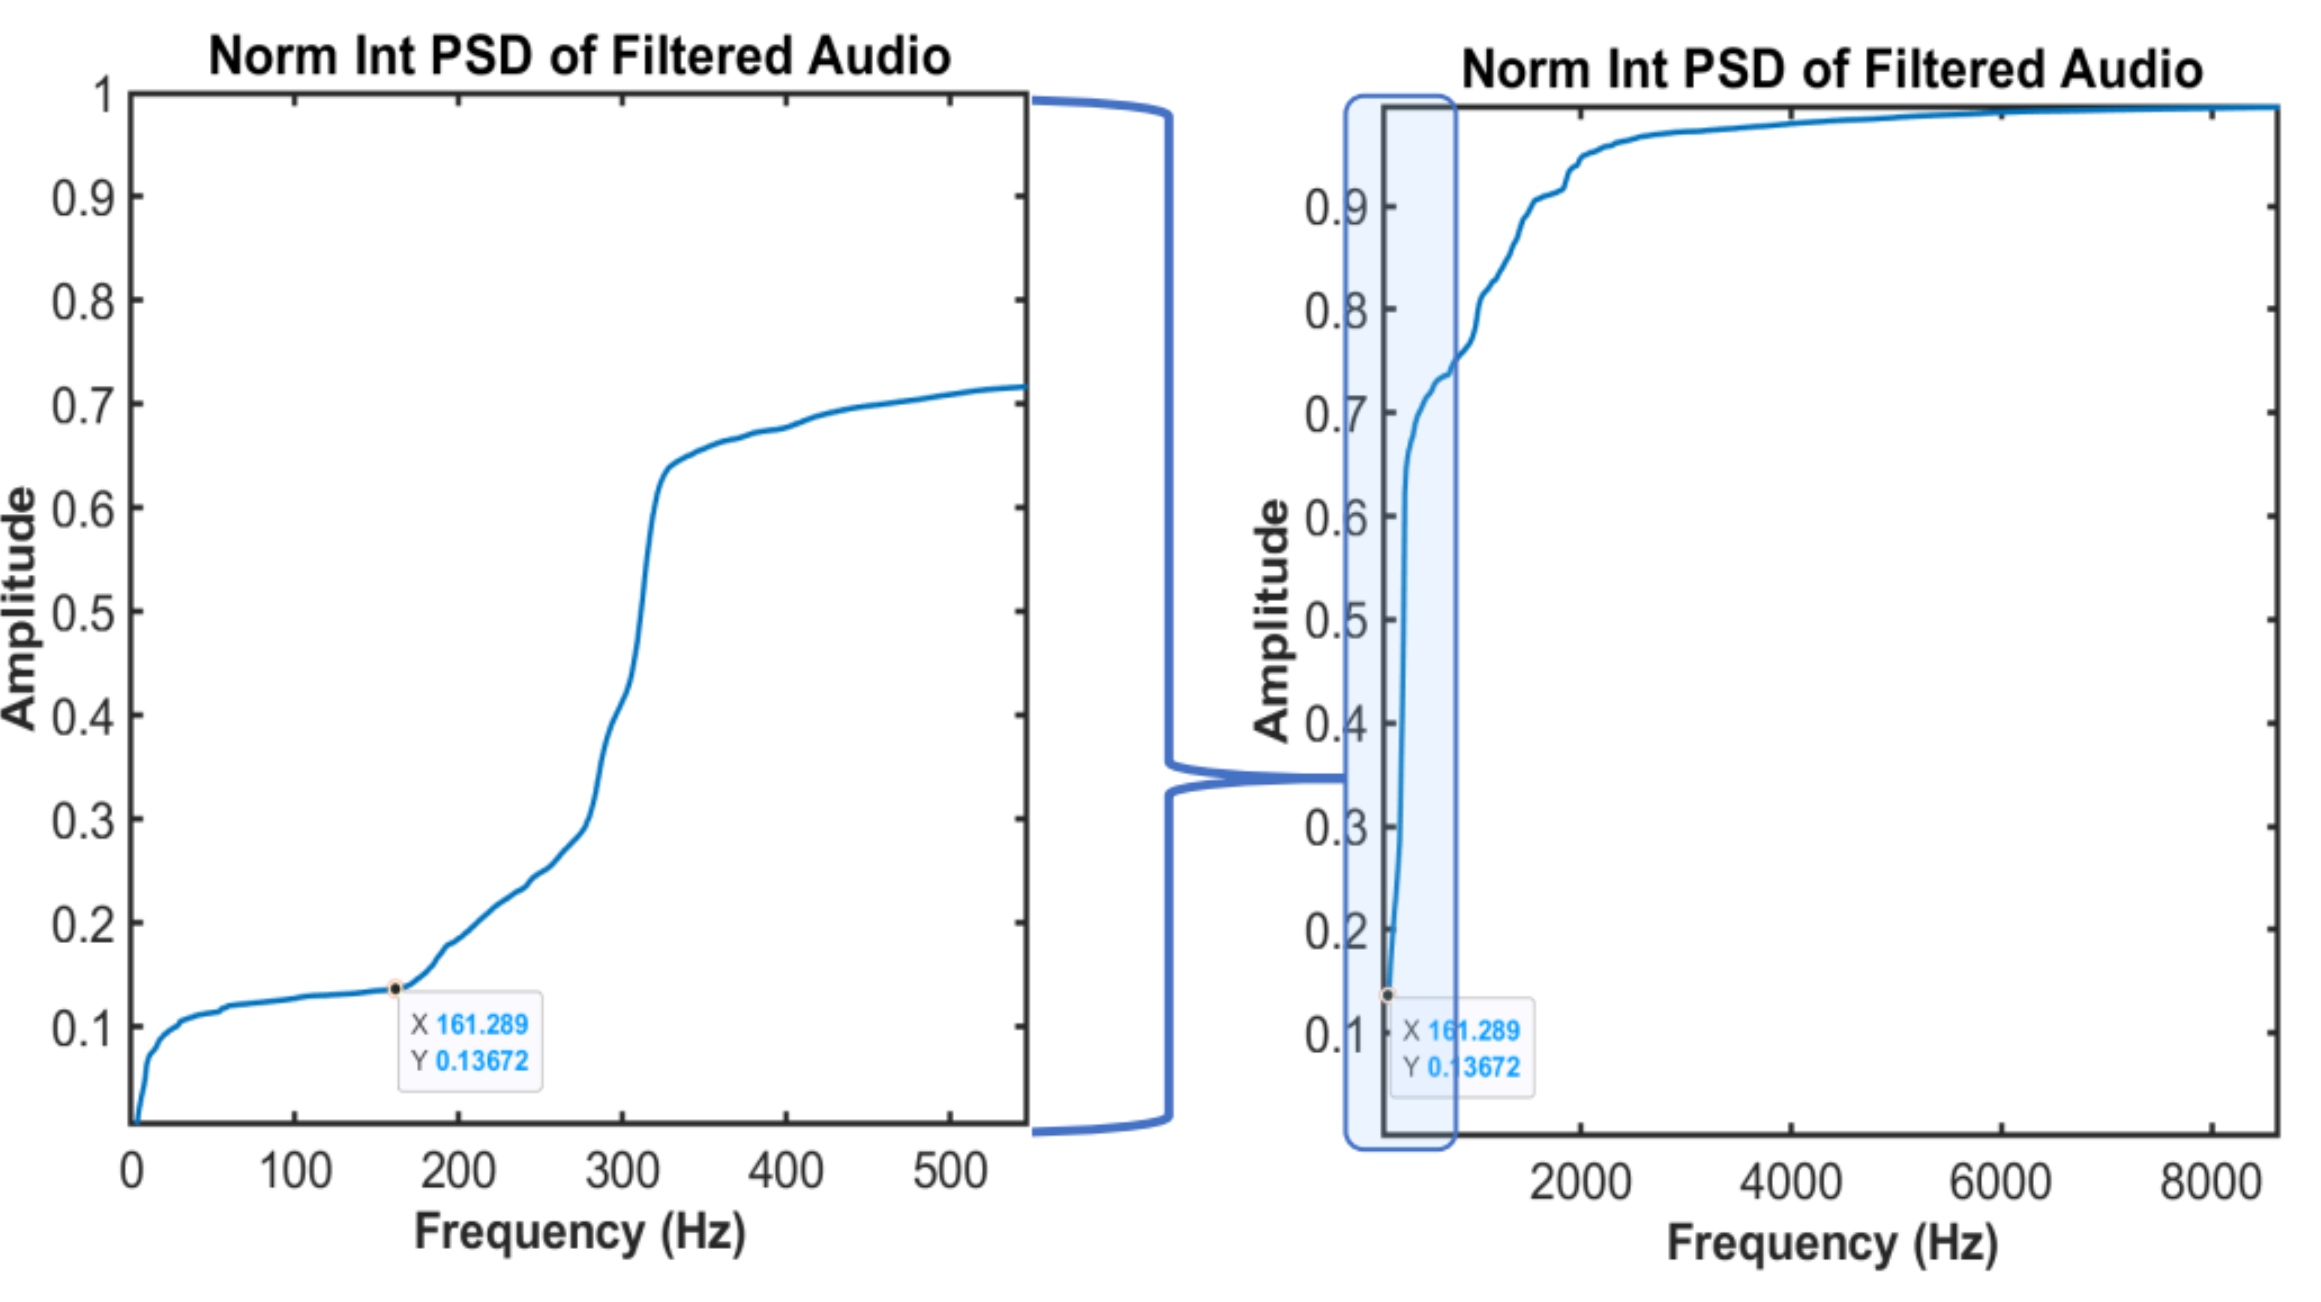
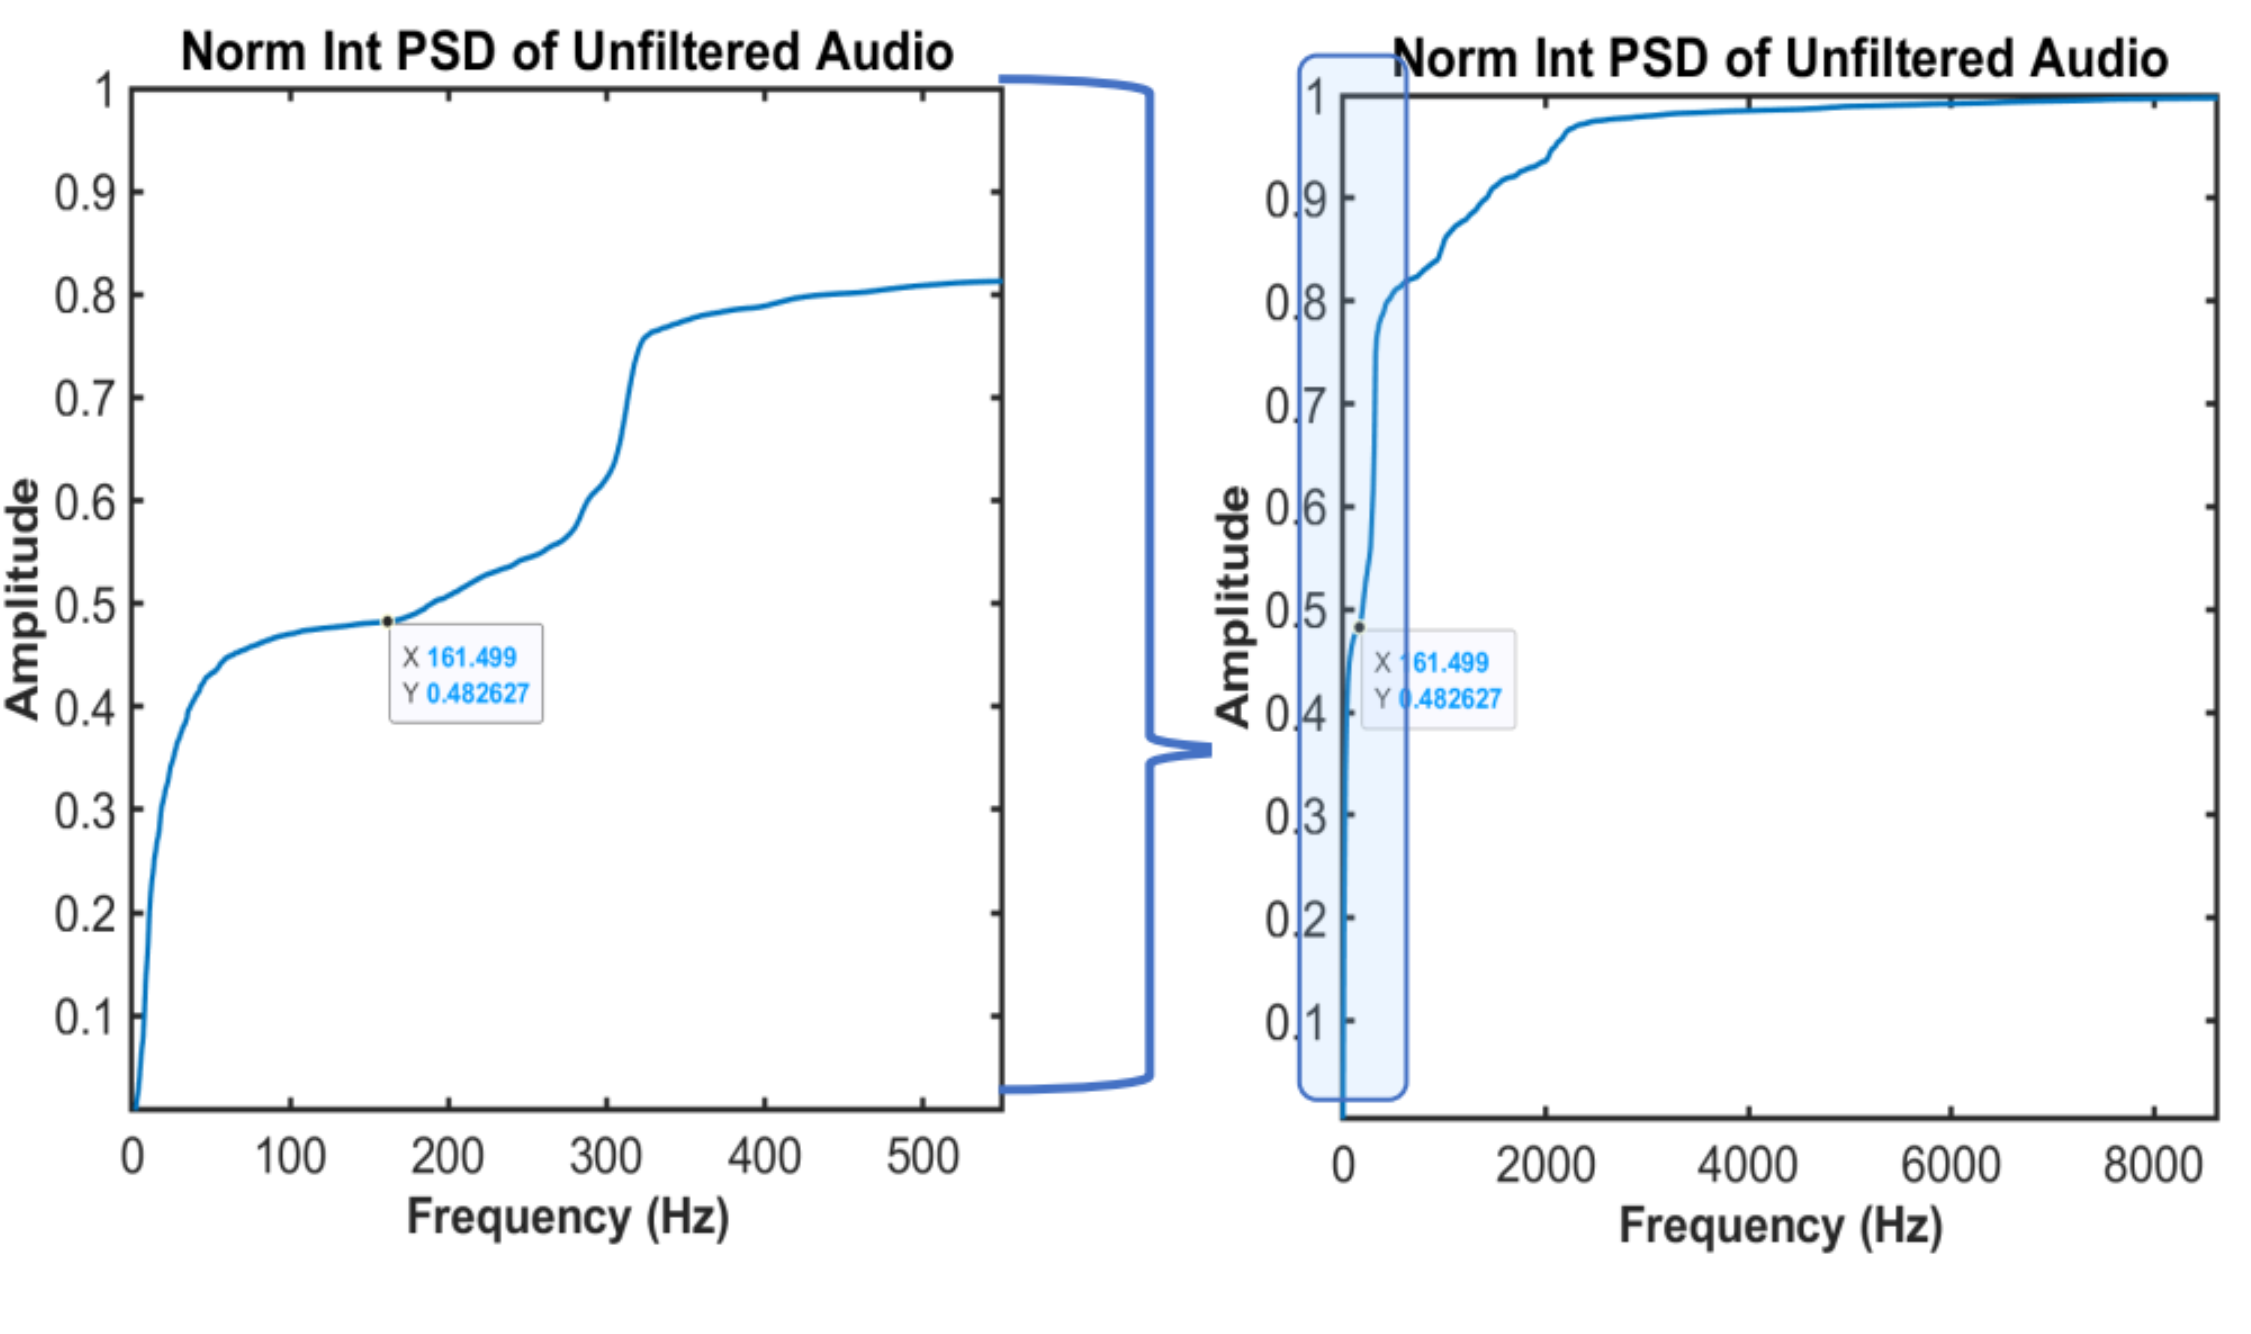
The result was much more apparent in the analysis of the Normal Integrated Power Spectral Density (Norm Int PSD) graphs of the data. These graphs indicate the percentage contribution or strength of particular frequencies in relation to the overall recorded signal. Having established the relationship between low frequency phenomena and plosive artefacts, it followed that this analysis is a powerful tool in characterizing plosive artefacts in audio. I went on to repeat the audio data collection, processing and analysis process using mesh filters with different properties. I then normalized the performance of each filter over the several iterations and was able to make reasonable conclusions on the performance of each.
The feedback I received as well as further literature review allowed me to comment on potential future work; redesigning further iterations of experiments, with the long term goal of developing a robust framework on filter performance by material and mesh density.